
【機械学習】SVMで見る学習から予測の基本的な流れ
MAX
MAX999blog


色々なアルゴリズムを試したりする時に、サンプルデータがあれば、気軽に試せるので非常にっ便利。
クラスタリングアルゴリズムには色々な方法があるが、各アルゴリズムの違いを知るためにも、色々なデータセットで試してみるのは重要である。
本記事ではクラスターを形成するデータを生成する方法について説明する。
可視化のために基本的に2次元で生成するが、次元数が増えてもクラスターを形成するデータが生成されるのは同じである(ただし、次元が増えると、クラスタリング時に次元の呪いにかかることはある)
一般的なクラスターを形成するデータの生成にはscikit-learnのmake_blobsを使う。
クラスター数や次元が少なければ線形分離可能なので、クラスタリングのアルゴリズムの実験だけでなく、分類の機械学習のサンプルデータとしても使える。
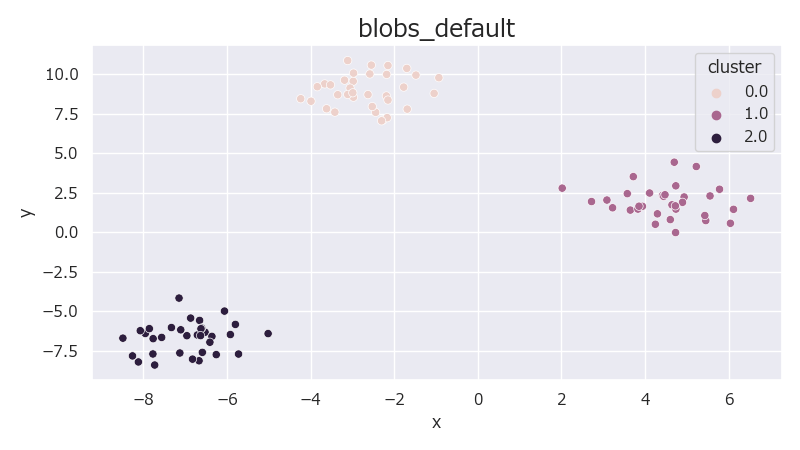
デフォルト設定でデータを生成すると以下のようなデータが生成される。
1from sklearn.datasets import make_blobs
2
3# デフォルト設定でデータ生成
4# random_stateだけ固定しておく
5X, y = make_blobs(random_state=42)
6
7# 生成データの散布図を描画
8data = pd.DataFrame(data=np.concatenate((X, y.reshape(-1, 1)), axis=1), columns=["x", "y", "cluster"])
9plt.figure(figsize=(8, 4.5), facecolor="w")
10sns.scatterplot(data=data, x="x", y="y", hue="cluster")
11title = f"blobs_default"
12plt.title(title, fontsize="x-large")
13plt.tight_layout()
14plt.show()
sklearn.datasets.make_blobsには引数の指定方法としてintやfloatで指定する方法とarray-likeで指定する方法がある。
intやfloatで指定する例のコードは以下のようになる。
1from sklearn.datasets import make_blobs
2
3n_samples = 200 # 生成するデータ量。デフォルトは100。
4n_features = 2 # 生成するデータの次元。デフォルトは2。
5centers = 5 # 生成するクラスターの中心の数。デフォルトはNone。Noneの場合3つの中心が生成される。
6cluster_std = 0.5 # 各クラスターの標準偏差。デフォルトは1。
7center_box = (-15.0, 15.0) # クラスター中心が生成される範囲。デフォルトは-10~10
8shuffle = True
9random_state = 42
10
11X, y = make_blobs(
12    n_samples=n_samples,
13    n_features=n_features,
14    centers=centers,
15    cluster_std=cluster_std,
16    center_box=center_box,
17    shuffle=shuffle,
18    random_state=random_state
19)
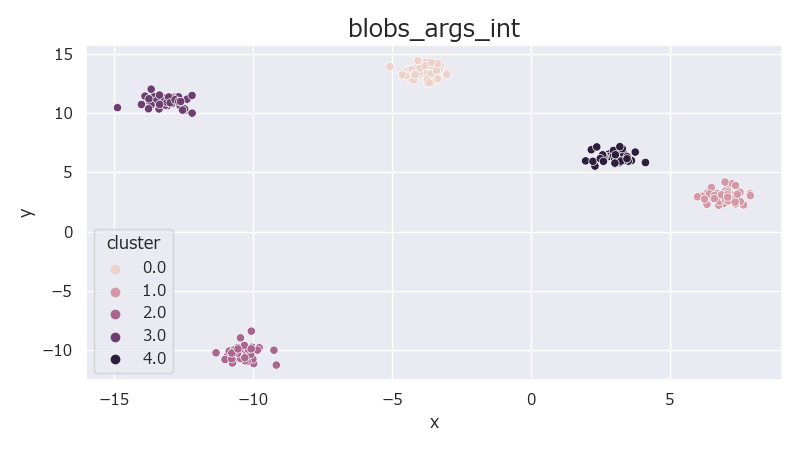
データの行数や列数だけでなく、クラスター数も自然数で指定可能。
また全クラスター共通で標準偏差もfloatで指定可能。
クラスターの中心が生成される範囲はタプルで指定可能。
1# データの可視化
2data = pd.DataFrame(data=np.concatenate((X, y.reshape(-1, 1)), axis=1), columns=["x", "y", "cluster"])
3plt.figure(figsize=(8, 4.5), facecolor="w")
4sns.scatterplot(data=data, x="x", y="y", hue="cluster")
5title = f"blobs_args_int"
6plt.title(title, fontsize="x-large")
7plt.tight_layout()
8plt.show()
1from sklearn.datasets import make_blobs
2
3n_samples = [100, 50, 150] # 各クラスターのサンプル数を指定
4centers = [(1, 1), (5, 5), (10, 10)] # 各クラスターの中心位置を指定
5cluster_std = [0.5, 1.0, 2] # 各クラスターの標準偏差を指定
6shuffle = True
7random_state = 42
8# centersを中心座標のリストで指定した場合、n_featuresとcenter_boxは無視される
9n_features = 20 # centersをarray-likeで指定した場合、centersで指定した次元になるので無視される
10center_box = (-1.0, 1.0) # centersで各クラスターの中心を個別に指定した場合、無視される
11
12X, y = make_blobs(
13    n_samples=n_samples,
14    n_features=n_features,
15    centers=centers,
16    cluster_std=cluster_std,
17    center_box=center_box,
18    shuffle=shuffle,
19    random_state=random_state
20)
各クラスター毎にサンプル数やクラスターの中心、標準偏差を指定可能。
配列の長さが合わない場合はエラーとなる。
データの次元数はcentersの各タプルで決まる。
各クラスター中心の座標を2次元で指定すればデータも2次元で、クラスター中心を3次元にすれば3次元のデータが生成される。低次元でクラスター中心をランダムに生成したくない場合に使える。
1# データの可視化
2data = pd.DataFrame(data=np.concatenate((X, y.reshape(-1, 1)), axis=1), columns=["x", "y", "cluster"])
3plt.figure(figsize=(8, 4.5), facecolor="w")
4sns.scatterplot(data=data, x="x", y="y", hue="cluster")
5title = f"blobs_args_array-like"
6plt.title(title, fontsize="x-large")
7plt.tight_layout()
8plt.show()
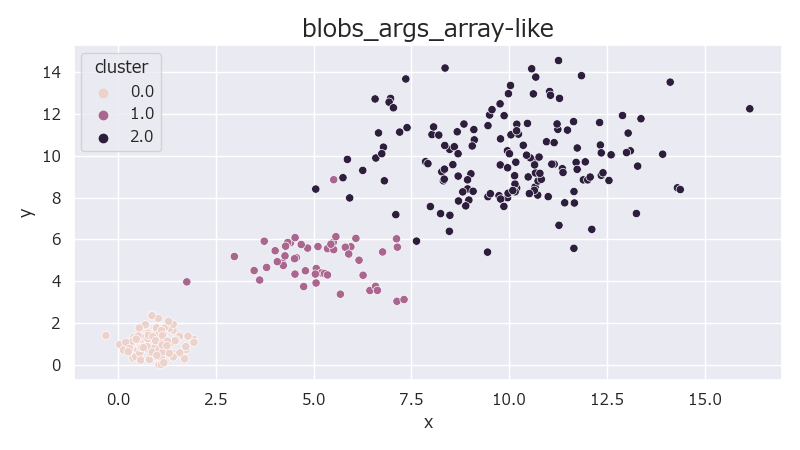
分散の異なるクラスターが3つ作成される。
n_samplesをリストで指定することで各クラスターのサンプル数を個別に指定可能。
この時、centersにNoneを指定することで、クラスター中心をcenter_boxの範囲でランダムに生成できるようになる。
また、centersを指定しない場合、n_featuresでデータの次元数を指定できる。
1from sklearn.datasets import make_blobs
2
3n_samples = [100, 50, 150] # 各クラスターのサンプル数を指定
4n_features = 20 # centersがNoneの場合は有効
5centers = None # Noneでn_samplesがarray_likeの場合、array-likeの長さの分だけクラスター中心がランダムに生成される
6cluster_std = [0.5, 1.0, 2] # 各クラスターの標準偏差を指定
7center_box = (-15.0, 15.0) # centersがNoneの場合は有効
8shuffle = True
9random_state = 42
10
11X, y = make_blobs(
12    n_samples=n_samples,
13    n_features=n_features,
14    centers=centers,
15    cluster_std=cluster_std,
16    center_box=center_box,
17    shuffle=shuffle,
18    random_state=random_state
19)
20print(f"{X.shape=}")
21# X.shape=(300, 20)
上記の例では20列のデータが生成される(20列なので可視化は不可)
make_circlesを使うことで、円状に分布するデータを生成できる。生成できる円は2重と決まっている。
1from sklearn.datasets import make_circles
2
3# デフォルトでデータ生成。random_stateのみ固定
4X, y = make_circles(random_state=42)
5# データの可視化
6data = pd.DataFrame(data=np.concatenate((X, y.reshape(-1, 1)), axis=1), columns=["x", "y", "cluster"])
7plt.figure(figsize=(8, 4.5), facecolor="w")
8sns.scatterplot(data=data, x="x", y="y", hue="cluster")
9title = f"circles_default"
10plt.title(title, fontsize="x-large")
11plt.tight_layout()
12plt.show()
13# とても綺麗な円が出来上がりました。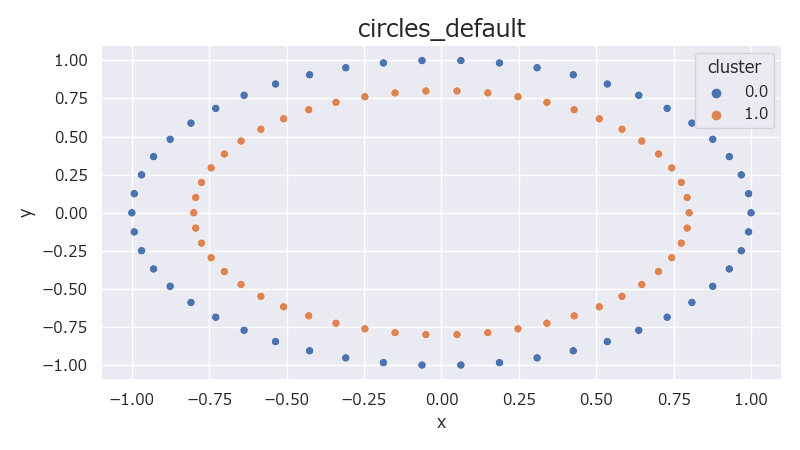
上記のグラフは縦横の比が1:1でないのでぱっと見は楕円に見えるが、グラフの目盛りを見ると円であることが分かる。
サンプル数、ノイズ、外側の円に対する内側の円の半径の比率を指定可能。
1from sklearn.datasets import make_circles
2
3n_samples = 200 # サンプル数
4shuffle = True
5noise = 0.05 # ガウシアンノイズの標準偏差。デフォルトはNone(ノイズなし)
6random_state = 42
7factor = 0.5 # 外側の円に対する内側の円の半径の比率。0~1で指定。デフォルトは0.8
8
9X, y = make_circles(
10    n_samples=n_samples,
11    shuffle=shuffle,
12    noise=noise,
13    random_state=random_state,
14    factor=factor
15)
1# データの可視化
2data = pd.DataFrame(data=np.concatenate((X, y.reshape(-1, 1)), axis=1), columns=["x", "y", "cluster"])
3plt.figure(figsize=(8, 4.5), facecolor="w")
4sns.scatterplot(data=data, x="x", y="y", hue="cluster")
5title = f"circles_args_int"
6plt.title(title, fontsize="x-large")
7plt.tight_layout()
8plt.show()
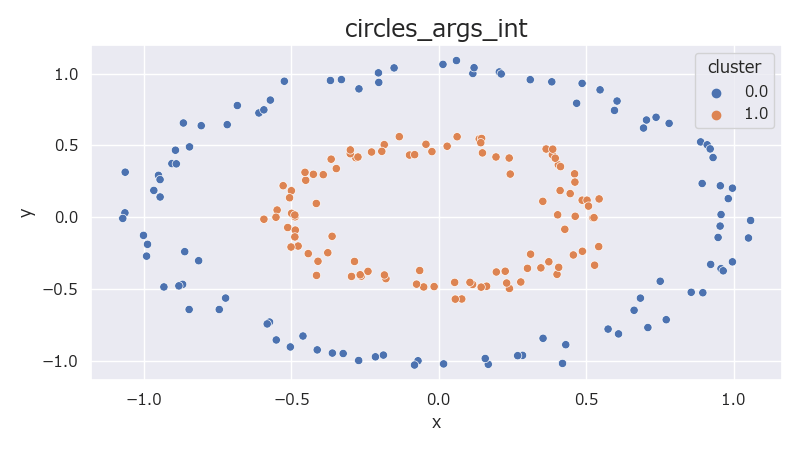
noiseを指定することで、ある程度、データをばらけさせることが可能。
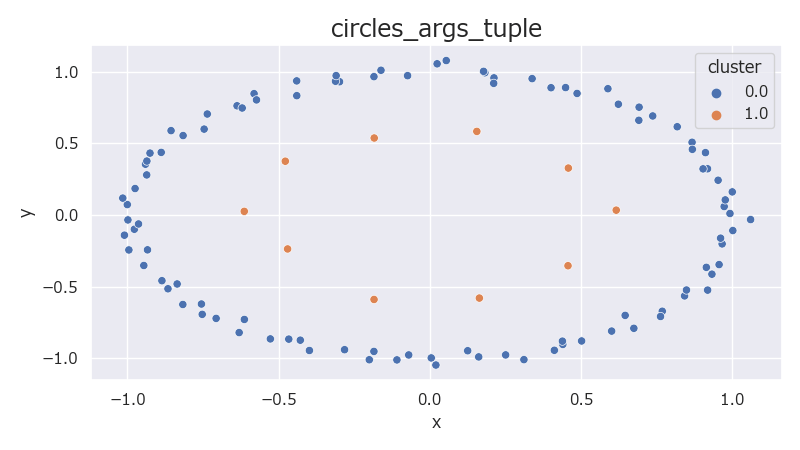
n_samplesについてはタプルで外側の円と内側の円のサンプル数を個別に指定できる。
タプルの0番目は外側の円のサンプル数、1番目は内側の円のサンプル数となる。
1from sklearn.datasets import make_circles
2
3n_samples = (100, 10) # 各円のサンプル数
4shuffle = True
5noise = 0.03 # ガウシアンノイズの標準偏差。デフォルトはNone(ノイズなし)
6random_state = 42
7factor = 0.6 # 外側の円に対する内側の円の半径の比率。0~1で指定。デフォルトは0.8
8
9X, y = make_circles(
10    n_samples=n_samples,
11    shuffle=shuffle,
12    noise=noise,
13    random_state=random_state,
14    factor=factor
15)
1# データの可視化
2data = pd.DataFrame(data=np.concatenate((X, y.reshape(-1, 1)), axis=1), columns=["x", "y", "cluster"])
3plt.figure(figsize=(8, 4.5), facecolor="w")
4sns.scatterplot(data=data, x="x", y="y", hue="cluster")
5title = f"circles_args_tuple"
6plt.title(title, fontsize="x-large")
7plt.tight_layout()
8plt.show()
1from sklearn.datasets import make_blobs
2
3# クラスターデータの生成
4# 引数をint, floatで指定する例
5n_samples = 200 # 生成するデータ量。デフォルトは100。
6n_features = 2 # 生成するデータの次元。デフォルトは2。
7centers = 5 # 生成するクラスターの中心の数。デフォルトはNone。Noneの場合3つの中心が生成される。
8cluster_std = 0.5 # 各クラスターの標準偏差。デフォルトは1。
9center_box = (-15.0, 15.0) # クラスター中心が生成される範囲。デフォルトは-10~10
10shuffle = True
11random_state = 42
12
13X, y = make_blobs(
14    n_samples=n_samples,
15    n_features=n_features,
16    centers=centers,
17    cluster_std=cluster_std,
18    center_box=center_box,
19    shuffle=shuffle,
20    random_state=random_state
21)
22
23# 引数をarray-likeで指定する例
24n_samples = [100, 50, 150] # 各クラスターのサンプル数を指定
25centers = [(1, 1), (5, 5), (10, 10)] # 各クラスターの中心位置を指定
26cluster_std = [0.5, 1.0, 2] # 各クラスターの標準偏差を指定
27shuffle = True
28random_state = 42
29# centersを中心座標のリストで指定した場合、n_featuresとcenter_boxは無視される
30n_features = 20 # centersをarray-likeで指定した場合、centersで指定した次元になるので無視される
31center_box = (-1.0, 1.0) # centersで各クラスターの中心を個別に指定した場合、無視される
32
33X, y = make_blobs(
34    n_samples=n_samples,
35    n_features=n_features,
36    centers=centers,
37    cluster_std=cluster_std,
38    center_box=center_box,
39    shuffle=shuffle,
40    random_state=random_state
41)
42
43# 2重円のデータ生成
44from sklearn.datasets import make_circles
45# 外側と内側の円個別でサンプル数指定
46n_samples = (100, 10) # 各円のサンプル数
47# 2つの円で均等にサンプル数指定
48n_samples = 200 # サンプル数
49
50shuffle = True
51noise = 0.05 # ガウシアンノイズの標準偏差。デフォルトはNone(ノイズなし)
52random_state = 42
53factor = 0.5 # 外側の円に対する内側の円の半径の比率。0~1で指定。デフォルトは0.8
54
55X, y = make_circles(
56    n_samples=n_samples,
57    shuffle=shuffle,
58    noise=noise,
59    random_state=random_state,
60    factor=factor
61)
62