【matplotlib】軸の単位をカスタマイズして科学記数法以外に設定する
MAX
MAX999blog


グラフ描画時の凡例のハンドラーの大きさ(縦、横)をそれぞれ変更する。
グラフによっては凡例のスペースを切り詰めたい時もあったりするため、凡例を省スペース化したい時などに使うかもしれない。
seabornのtitanicをサンプルデータとして使用する。
1import numpy as np
2import pandas as pd
3
4import matplotlib.pyplot as plt
5import japanize_matplotlib
6import seaborn as sns
7
8%matplotlib inline
9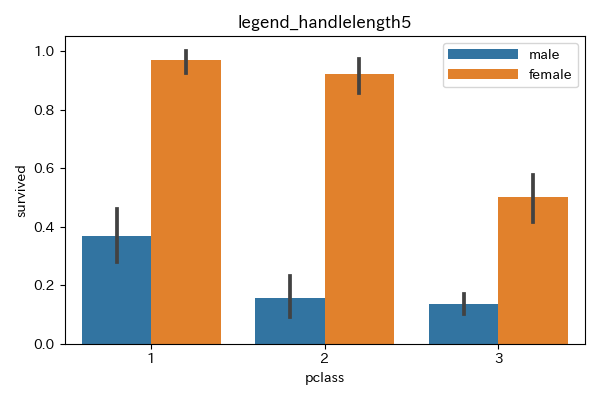
10df_titanic = sns.load_dataset("titanic")plt.legendにhandlelengthを指定することで変更可能。
単位はemでデフォルトは2となっている。
1# グラフのサイズ、背景色設定
2plt.figure(figsize=(6, 4), facecolor="w")
3# 棒グラフ作成
4sns.barplot(data=df_titanic, x="pclass", y="survived", hue="sex")
5# 凡例の設定
6# 凡例ハンドルの長さを1.0emに設定
7plt.legend(handlelength=1)
8# グラフタイトル設定
9plt.title(f"legend_handlelength1")
10plt.tight_layout()
11plt.show()

1# グラフのサイズ、背景色設定
2plt.figure(figsize=(6, 4), facecolor="w")
3# 棒グラフ作成
4sns.barplot(data=df_titanic, x="pclass", y="survived", hue="sex")
5# 凡例の設定
6# 凡例ハンドルの長さを5.0emに設定
7plt.legend(handlelength=5)
8# グラフタイトル設定
9plt.title(f"legend_handlelength5")
10plt.tight_layout()
11plt.show()
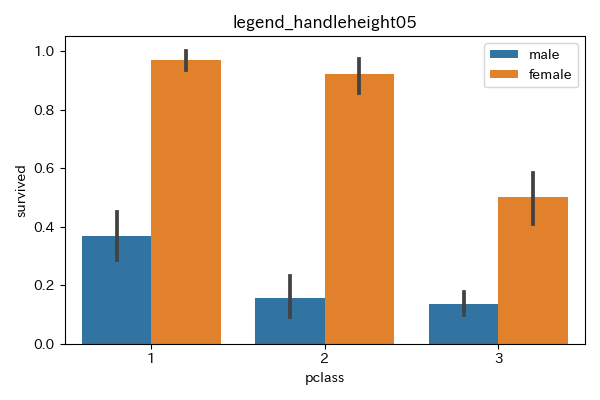
plt.legendにhandleheightを指定することで変更可能。
単位はemで、デフォルト値は0.7。
1# グラフのサイズ、背景色設定
2plt.figure(figsize=(6, 4), facecolor="w")
3# 棒グラフ作成
4sns.barplot(data=df_titanic, x="pclass", y="survived", hue="sex")
5# 凡例の設定
6# 凡例ハンドルの高さを0.5emに設定
7plt.legend(handleheight=0.5)
8# グラフタイトル設定
9plt.title(f"legend_handleheight05")
10plt.tight_layout()
11plt.show()
1# グラフのサイズ、背景色設定
2plt.figure(figsize=(6, 4), facecolor="w")
3# 棒グラフ作成
4sns.barplot(data=df_titanic, x="pclass", y="survived", hue="sex")
5# 凡例の設定
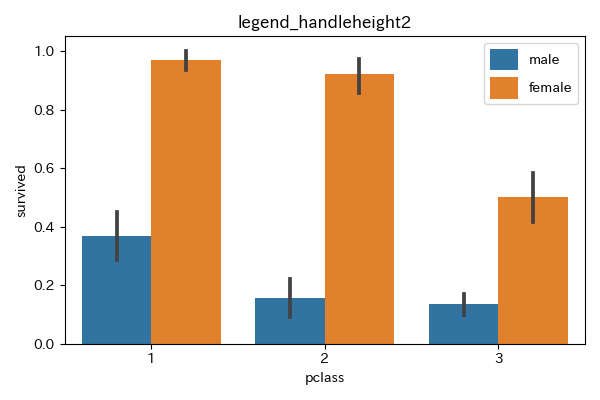
6# 凡例ハンドルの高さを2.0emに設定
7plt.legend(handleheight=2)
8# グラフタイトル設定
9plt.title(f"legend_handleheight2")
10plt.tight_layout()
11plt.show()
plt.legendにhandletextpadを指定することで、ハンドルとラベル(文字列)の間隔を変更可能。
単位はemでデフォルト値は0.8。
1# グラフのサイズ、背景色設定
2plt.figure(figsize=(6, 4), facecolor="w")
3# 棒グラフ作成
4sns.barplot(data=df_titanic, x="pclass", y="survived", hue="sex")
5# 凡例の設定
6# 凡例ハンドルとラベルの間隔を0.2emに設定
7plt.legend(handletextpad=0.2)
8# グラフタイトル設定
9plt.title(f"legend_handletextpad02")
10plt.tight_layout()
11plt.show()

1# グラフのサイズ、背景色設定
2plt.figure(figsize=(6, 4), facecolor="w")
3# 棒グラフ作成
4sns.barplot(data=df_titanic, x="pclass", y="survived", hue="sex")
5# 凡例の設定
6# 凡例ハンドルとラベルの間隔を2emに設定
7plt.legend(handletextpad=2)
8# グラフタイトル設定
9plt.title(f"legend_handletextpad2")
10plt.tight_layout()
11plt.show()

凡例を省スペース化したい時は大体これぐらいの設定が良い感じ。
1# 凡例ハンドルの幅を1emに設定
2# 凡例ハンドルの高さを0.5emに設定
3# 凡例ハンドルとラベルの間隔を0.2emに設定
4plt.legend(handlelength=1, handleheight=0.5, handletextpad=0.2)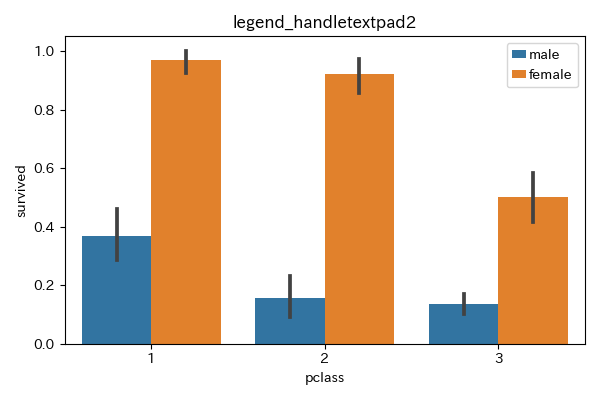
凡例のその他の設定については以下の記事も参照