【matplotlib】凡例の列数を変更する【Python】
MAX
MAX999blog


matplotlibで作成したグラフの凡例を色々装飾(フォント、斜字、太字、サイズ変更など)を行う。
わざわざ凡例のタイトルを色々修飾することはないかもしれないが、FontPropertiesで設定可能な内容が変更可能な内容となるため、グラフタイトルや軸ラベルなど、フォント全般に対して応用できる。
seabornからtitanicを読み込む。
1import numpy as np
2import pandas as pd
3
4import matplotlib.pyplot as plt
5import japanize_matplotlib
6import seaborn as sns
7
8%matplotlib inline
9
10df_titanic = sns.load_dataset("titanic")
凡例のタイトルを設定するだけだと、フォントの設定はデフォルトのものが使用されるため、凡例のラベルなどと同じになる。
1# グラフのサイズ、背景色設定
2plt.figure(figsize=(6, 4), facecolor="w")
3# 棒グラフ作成
4sns.barplot(data=df_titanic, x="sex", y="survived", hue="class")
5# 凡例の設定
6plt.legend(title="class")
7# グラフタイトル設定
8plt.title(f"legend_title")
9plt.tight_layout()
10plt.show()

plt.legend()にtitle_fontpropertiesを指定することで、凡例タイトルのフォントを色々装飾できる。
title_fontpropertiesはFontPropertiesかdictを指定可能。
(参考)plt.legend()
https://matplotlib.org/3.5.0/api/legend_api.html?highlight=title_fontproperties
(参考)FontProperties
https://matplotlib.org/3.5.0/api/font_manager_api.html#matplotlib.font_manager.FontProperties
文字列と数値で指定可能なプロパティついては以下で紹介して行くが、文字列のみ指定可能なプロパティはFontPropertiesのページを参照。
| 指定可能な文字列 | 対応する値 |
|---|---|
| xx-small | 0.579 |
| x-small | 0.694 |
| small | 0.833 |
| medium | 1.0 |
| large | 1.200 |
| x-large | 1.440 |
| xx-large | 1.728 |
タイトル系だと大体largeかx-largeぐらいが適切な大きさになりやすい。
| 指定可能な文字列 | 対応する値 |
|---|---|
| ultra-condensed | 100 |
| extra-condensed | 200 |
| condensed | 300 |
| semi-condensed | 400 |
| normal | 500 |
| semi-expanded | 600 |
| semi-extended | 600 |
| expanded | 700 |
| extended | 700 |
| extra-expanded | 800 |
| extra-extended | 800 |
| ultra-expanded | 900 |
| ultra-extended | 900 |
| 指定可能な文字列 | 対応する値 |
|---|---|
| ultra-light | 100 |
| light | 200 |
| normal | 400 |
| regular | 400 |
| book | 400 |
| medium | 500 |
| roman | 500 |
| semibold | 600 |
| demibold | 600 |
| demi | 600 |
| bold | 700 |
| heavy | 800 |
| extra bold | 800 |
| black | 900 |
100単位の細かい違いは体感しにくいので、ざっくりlightとboldが使えれば十分な気がする。
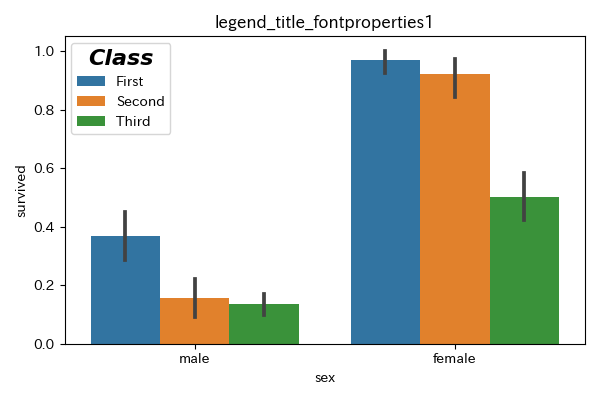
title_fontpropertiesは辞書、もしくはFontPropertiesを指定することができる。
1# グラフのサイズ、背景色設定
2plt.figure(figsize=(6, 4), facecolor="w")
3# 棒グラフ作成
4sns.barplot(data=df_titanic, x="sex", y="survived", hue="class")
5# 凡例の設定
6plt.legend(title="Class",
7           title_fontproperties={"family": "sans-serif",# サンセリフ
8                                 "style": "italic", # 斜自体
9                                 "weight": 700, # bold
10                                 "size": 16
11                                }
12          )
13# グラフタイトル設定
14plt.title(f"legend_title_fontproperties1")
15plt.tight_layout()
16plt.show()
1# グラフのサイズ、背景色設定
2plt.figure(figsize=(6, 4), facecolor="w")
3# 棒グラフ作成
4sns.barplot(data=df_titanic, x="sex", y="survived", hue="class")
5# 凡例の設定
6plt.legend(title="Class",
7           title_fontproperties={"family": "serif", # セリフ
8                                 "style": "oblique", # 斜字
9                                 "weight": "light", # 文字の太さ。200。
10                                 "size": "x-large" # 文字の大きさ。120%。
11                                }
12          )
13# グラフタイトル設定
14plt.title(f"legend_title_fontproperties2")
15plt.tight_layout()
16plt.show()

matplotlib.font_managerからFontPropertiesをimportする。
プロパティの値設定はインスタンス生成時にもできるし、インスタンス生成後でもできる。
setメソッドとgetメソッドを使うことに注意。
1from matplotlib.font_manager import FontProperties
2
3# インスタンス生成と初期値設定
4font_properties = FontProperties(family="serif", size="large")
5# インスタンスの各プロパティに値設定
6font_properties.set_style("oblique")
7font_properties.set_weight("bold")
8
9print(font_properties.get_style())
10# 'oblique'
11print(font_properties.get_weight())
12# 'bold'
なお、weightなどに設定できない値を設定しようとするとエラーとなり、設定可能な値を教えてくれる。
1# プロパティに設定できない値を設定しようとするとエラーとなる。
2font_properties.set_style("itaric")
3# ValueError: 'itaric' is not a valid value for style; supported values are 'normal', 'italic', 'oblique'1# グラフのサイズ、背景色設定
2plt.figure(figsize=(6, 4), facecolor="w")
3# 棒グラフ作成
4sns.barplot(data=df_titanic, x="sex", y="survived", hue="class")
5# 凡例の設定
6plt.legend(title="Class",
7 title_fontproperties=font_properties
8 )
9# グラフタイトル設定
10plt.title(f"legend_title_fontproperties3")
11plt.tight_layout()
12plt.show()

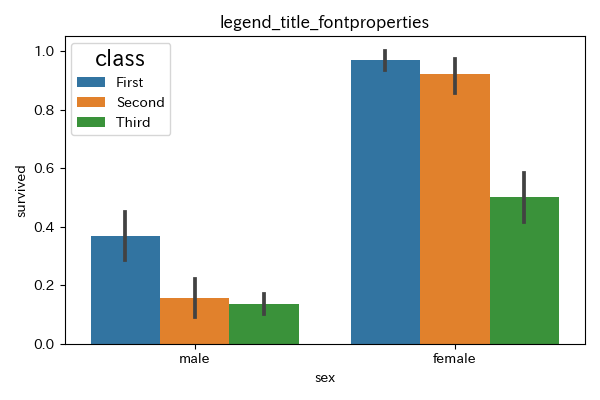
familyを指定しない場合、sizeの設定は反映されるが、styleやweightなどの設定は反映されないので注意。
1# グラフのサイズ、背景色設定
2plt.figure(figsize=(6, 4), facecolor="w")
3# 棒グラフ作成
4sns.barplot(data=df_titanic, x="sex", y="survived", hue="class")
5# 凡例の設定
6# familyを指定しないと、styleやweightが反映されない。sizeは反映される。
7plt.legend(title="class",
8           title_fontproperties={"style": "italic",
9                                 "weight": "bold",
10                                 "size": "x-large"}
11          )
12# グラフタイトル設定
13plt.title(f"legend_title_fontproperties")
14plt.tight_layout()
15plt.show()
1# 辞書で設定する場合
2plt.legend(title="Class",
3           title_fontproperties={"family": "serif", # セリフ
4                                 "style": "oblique", # 斜字
5                                 "weight": "light", # 文字の太さ。200。
6                                 "size": "x-large" # 文字の大きさ。120%。
7                                }
8          )
9
10# FontPropertiesで設定する場合
11from matplotlib.font_manager import FontProperties
12
13# インスタンス生成と初期値設定
14font_properties = FontProperties(family="serif", size="large")
15# インスタンスの各プロパティに値設定
16font_properties.set_style("oblique")
17font_properties.set_weight("bold")
18
19# 凡例の設定
20plt.legend(title="Class",
21           title_fontproperties=font_properties
22          )
個人的にはわざわざフォントの指定のためにFontPropertiesをimportしてインスタンス生成をする機会はあまりないと思う。
notebookなどでグラフ作成するだけなら、辞書で指定できれば十分な気がする。
FontPropertiesはインスタンスにプロパティを設定する時に、設定できない値があればエラーとなるため、グラフ作成よりも前にエラーを検知できるので、そこが利点かもしれない。