【matplotlib】軸の単位をカスタマイズして科学記数法以外に設定する
MAX
MAX999blog

matplotlibで作成したグラフタイトルのフォントサイズや色を変更する。
グラフタイトルの位置はlocやyで指定できるが、フォントサイズや色、太さなどの装飾はfontdictという引数を使用する。
seabornからtipsを読み込む。
1import numpy as np
2import pandas as pd
3
4import matplotlib.pyplot as plt
5import japanize_matplotlib
6import seaborn as sns
7
8%matplotlib inline
9
10df_tips = sns.load_dataset("tips")fontdictは名前の通り、辞書型でグラフタイトルのフォントを色々設定するための引数である。
(参考)plt.title()
https://matplotlib.org/3.5.0/api/_as_gen/matplotlib.pyplot.title.html
公式ページには、
が記載されているが、この他にも指定できる。
ただし、styleの設定を反映させたければ、familyも指定する必要がある。
1# グラフのサイズ、背景色設定
2plt.figure(figsize=(6, 4), facecolor="w")
3# 棒グラフ作成
4sns.barplot(data=df_tips, x="sex", y="total_bill", hue="smoker")
5# 凡例の設定
6plt.legend()
7# グラフタイトル設定
8# fontdictでタイトルのフォント設定。
9plt.title(f"Title", fontdict={"family": "serif",
10                              "style": "oblique",
11                              "fontsize": "large",
12                              "fontweight": "light",
13                              "color": "blue",
14                              "verticalalignment": "baseline",
15                              "horizontalalignment": "center",
16                             })
17plt.tight_layout()
18plt.show()
fontsizeは数値と文字列の両方が指定可能。
数値の場合は指定したptになる。
文字列の場合、デフォルトのフォントサイズに対する相対的な大きさになる。
| 指定可能な文字列 | 倍率 |
|---|---|
| xx-small | 0.579 |
| x-small | 0.694 |
| small | 0.833 |
| medium | 1.0 |
| large | 1.200 |
| x-large | 1.440 |
| xx-large | 1.728 |
タイトルは少し大きくしたいことが多いと思うので、よく使われるのはlargeかx-largeあたりだと思われる。
fontweightも数値と文字列で指定可能。
数値の場合は0〜1000。
文字列は指定した内容と対応する数値が決まっている。
| 指定可能な文字列 | 対応する値 |
|---|---|
| ultralight | 100 |
| light | 200 |
| normal | 400 |
| regular | 400 |
| book | 400 |
| medium | 500 |
| roman | 500 |
| semibold | 600 |
| demibold | 600 |
| demi | 600 |
| bold | 700 |
| heavy | 800 |
| extra bold | 800 |
| black | 900 |
fontsizeと異なり、相対的な倍率でなないことに注意。
また、同じ太さでも色々な表現がある。
実用的には「bold」と「light」ぐらいを覚えておけば十分。(そもそも100単位の変化はそんなに分からない)
(参考)fontsizeやfontweightの設定値のソースコード
colorで指定可能な色はmatplotlibのソースコードを参照。
va(verticalalignment)とha(horizontalalignment)は設定を変更しても違いがよく分からなかったので説明は割愛。
位置の変更は、locで水平位置を、yで垂直位置を変更可能。
1# グラフのサイズ、背景色設定
2plt.figure(figsize=(6, 4), facecolor="w")
3# 棒グラフ作成
4sns.barplot(data=df_tips, x="sex", y="total_bill", hue="smoker")
5# 凡例の設定
6plt.legend()
7# グラフタイトル設定
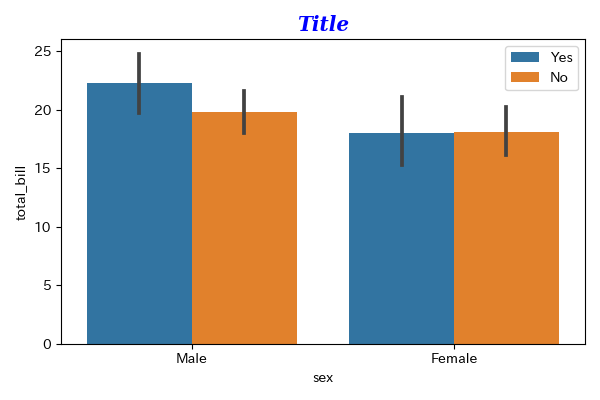
8# fontdictでタイトルのフォント設定。familyを設定しないと、styleが反映されない。
9plt.title(f"Title", fontdict={"family": "serif",
10 "style": "oblique",
11 "fontsize": "x-large",
12 "fontweight": "bold",
13 "color": "blue",
14 })
15plt.tight_layout()
16plt.show()
1# グラフのサイズ、背景色設定
2plt.figure(figsize=(6, 4), facecolor="w")
3# 棒グラフ作成
4sns.barplot(data=df_tips, x="sex", y="total_bill", hue="smoker")
5# 凡例の設定
6plt.legend()
7# グラフタイトル設定
8# fontdictでタイトルのフォント設定。familyを設定しないと、styleが反映されない。
9plt.title(f"Title", fontdict={"family": "serif",
10                              "style": "italic",
11                              "fontsize": 20,
12                              "fontweight": 700,
13                              "color": "b",
14                             })
15plt.tight_layout()
16plt.show()
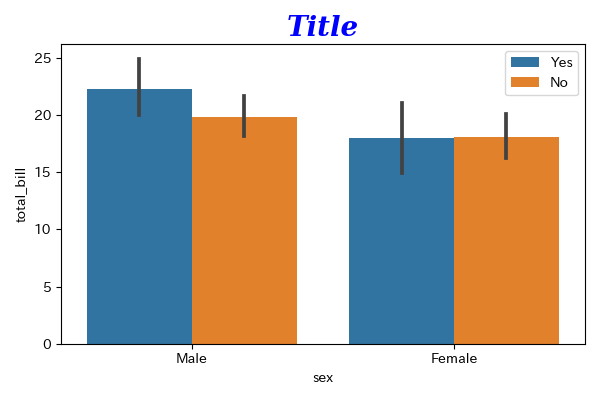
公式に記載されているfontsize, fontweight, colorはfamilyを指定しなくても反映されるが、styleなどの公式に記載されていない設定はfamilyを指定しないと反映されない。
1# グラフのサイズ、背景色設定
2plt.figure(figsize=(6, 4), facecolor="w")
3# 棒グラフ作成
4sns.barplot(data=df_tips, x="sex", y="total_bill", hue="smoker")
5# 凡例の設定
6plt.legend()
7# グラフタイトル設定
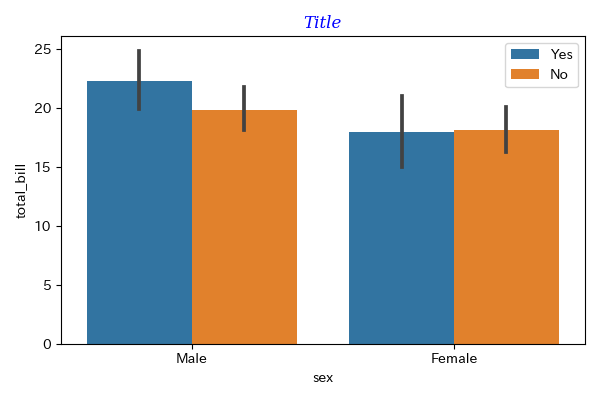
8# fontdictでタイトルのフォント設定。familyを設定しないと、大きさ、太さ、色しか反映されない。
9plt.title(f"Title", fontdict={"style": "oblique",
10 "fontsize": "x-large",
11 "fontweight": "bold",
12 "color": "red",
13 })
14plt.tight_layout()
15plt.show()
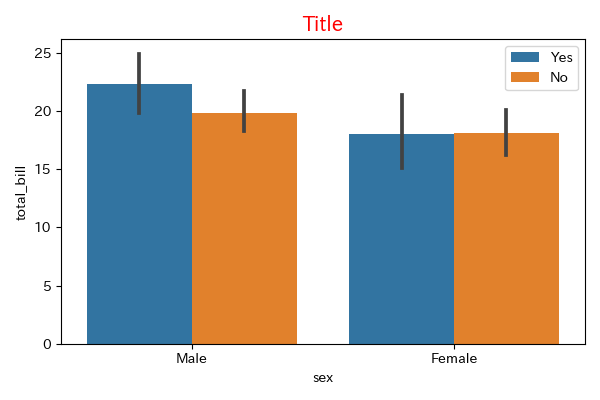
グラフタイトルのサイズ、太さ、色はfontdictからfontsize, fontweight, colorを設定する。
1# fontdictでタイトルのフォント設定。familyを設定しないと、styleが反映されない。
2plt.title(f"Title", fontdict={"family": "serif",
3                              "style": "oblique",
4                              "fontsize": "x-large",
5                              "fontweight": "bold",
6                              "color": "blue",
7                             })
8
9# fontdictでタイトルのフォント設定。fontsize, fontweight, colorだけならfamilyの設定は不要。
10plt.title(f"Title", fontdict={"fontsize": "x-large",
11                              "fontweight": "bold",
12                              "color": "red",
13                             })
14
表示位置を調整したい場合はlocで水平位置、yで垂直位置を調整する。