【matplotlib】グラフの凡例の位置を変更する【seaborn】
MAX
MAX999blog


凡例のハンドラーと文字列の両方のサイズ変更を行う。
本記事では、凡例の文字サイズの変更を行うが、フォントサイズの指定方法は色々な場所(凡例タイトル、グラフタイトル、x軸、y軸など)で共通の設定なので、指定方法を覚えておくと、グラフ表現の幅が広がる。
seabornのtitanicをサンプルとして使用する。
1import numpy as np
2import pandas as pd
3
4import matplotlib.pyplot as plt
5import japanize_matplotlib
6import seaborn as sns
7
8%matplotlib inline
9
10df_titanic = sns.load_dataset("titanic")
特に何も設定せずに凡例を表示させると以下のようなグラフになる。
1# グラフのサイズ、背景色設定
2plt.figure(figsize=(6, 4), facecolor="w")
3# 棒グラフ作成
4sns.barplot(data=df_titanic, x="pclass", y="survived", hue="sex")
5# 凡例の設定
6plt.legend()
7# グラフタイトル設定
8plt.title(f"legend_fontsize_default11")
9plt.tight_layout()
10plt.show()
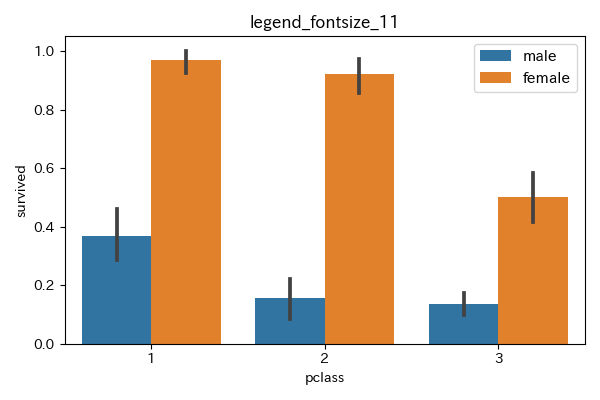
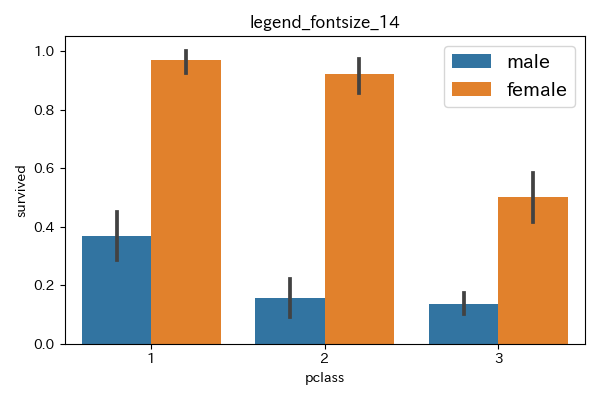
legendのfontsizeに数値を指定することで、凡例のハンドラーと文字のサイズを指定できる。
1# グラフのサイズ、背景色設定
2plt.figure(figsize=(6, 4), facecolor="w")
3# 棒グラフ作成
4sns.barplot(data=df_titanic, x="pclass", y="survived", hue="sex")
5# 凡例の設定。サイズを指定。
6plt.legend(fontsize=14)
7# グラフタイトル設定
8plt.title(f"legend_fontsize_14")
9plt.tight_layout()
10plt.show()
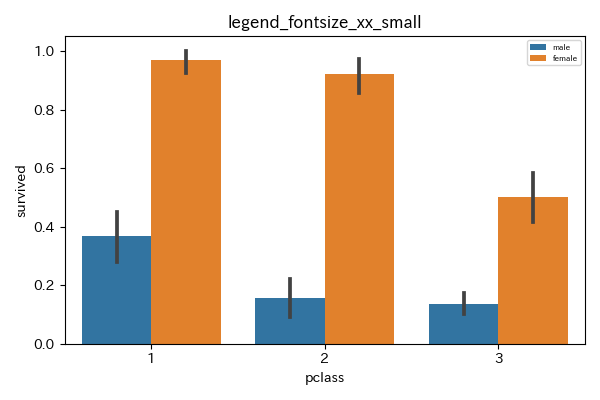
fontsizeに「large」「small」などの文字を指定することで、デフォルトのサイズから相対的なサイズを指定できる。
xx-small, x-small, small, medium, large, x-large, xx-largeが指定可能。
倍率は割と細かい。
1font_scalings = {
2    'xx-small': 0.579,
3    'x-small':  0.694,
4    'small':    0.833,
5    'medium':   1.0,
6    'large':    1.200,
7    'x-large':  1.440,
8    'xx-large': 1.728,
9    'larger':   1.2,
10    'smaller':  0.833,
11    None:       1.0,
12}
1# グラフのサイズ、背景色設定
2plt.figure(figsize=(6, 4), facecolor="w")
3# 棒グラフ作成
4sns.barplot(data=df_titanic, x="pclass", y="survived", hue="sex")
5# 凡例の設定。サイズを相対指定。
6plt.legend(fontsize="xx-small")
7# グラフタイトル設定
8plt.title(f"legend_fontsize_xx_small")
9plt.tight_layout()
10plt.show()
1# グラフのサイズ、背景色設定
2plt.figure(figsize=(6, 4), facecolor="w")
3# 棒グラフ作成
4sns.barplot(data=df_titanic, x="pclass", y="survived", hue="sex")
5# 凡例の設定。サイズを相対指定。
6plt.legend(fontsize="x-small")
7# グラフタイトル設定
8plt.title(f"legend_fontsize_x_small")
9plt.tight_layout()
10plt.show()

1# グラフのサイズ、背景色設定
2plt.figure(figsize=(6, 4), facecolor="w")
3# 棒グラフ作成
4sns.barplot(data=df_titanic, x="pclass", y="survived", hue="sex")
5# 凡例の設定。サイズを相対指定。
6plt.legend(fontsize="small")
7# グラフタイトル設定
8plt.title(f"legend_fontsize_small")
9plt.tight_layout()
10plt.show()

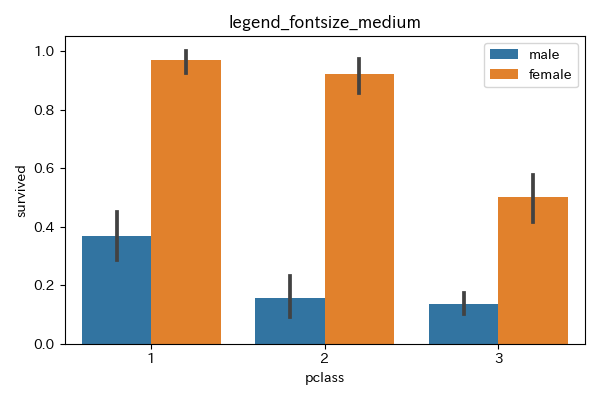
1# グラフのサイズ、背景色設定
2plt.figure(figsize=(6, 4), facecolor="w")
3# 棒グラフ作成
4sns.barplot(data=df_titanic, x="pclass", y="survived", hue="sex")
5# 凡例の設定。サイズを相対指定。
6plt.legend(fontsize="medium")
7# グラフタイトル設定
8plt.title(f"legend_fontsize_medium")
9plt.tight_layout()
10plt.show()
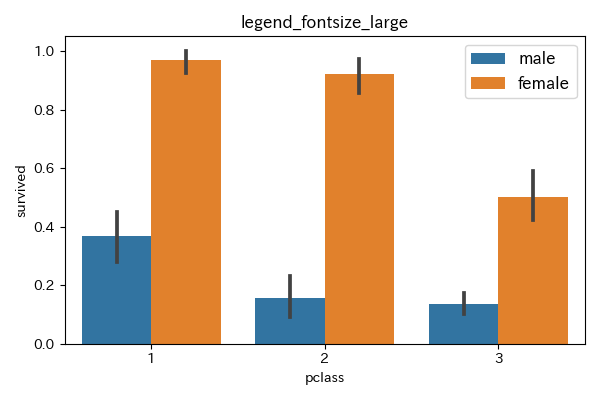
1# グラフのサイズ、背景色設定
2plt.figure(figsize=(6, 4), facecolor="w")
3# 棒グラフ作成
4sns.barplot(data=df_titanic, x="pclass", y="survived", hue="sex")
5# 凡例の設定。サイズを相対指定。
6plt.legend(fontsize="large")
7# グラフタイトル設定
8plt.title(f"legend_fontsize_large")
9plt.tight_layout()
10plt.show()
1# グラフのサイズ、背景色設定
2plt.figure(figsize=(6, 4), facecolor="w")
3# 棒グラフ作成
4sns.barplot(data=df_titanic, x="pclass", y="survived", hue="sex")
5# 凡例の設定。サイズを相対指定。
6plt.legend(fontsize="x-large")
7# グラフタイトル設定
8plt.title(f"legend_fontsize_x_large")
9plt.tight_layout()
10plt.show()

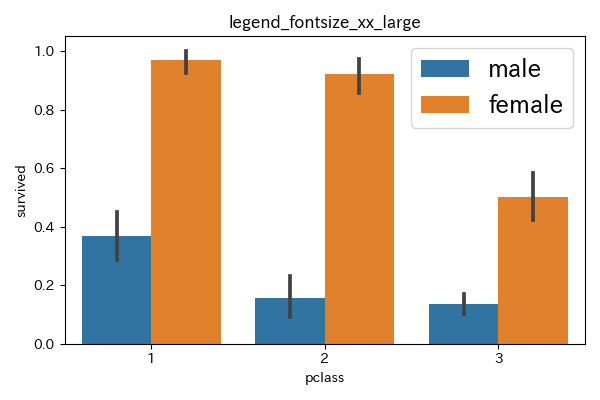
1# グラフのサイズ、背景色設定
2plt.figure(figsize=(6, 4), facecolor="w")
3# 棒グラフ作成
4sns.barplot(data=df_titanic, x="pclass", y="survived", hue="sex")
5# 凡例の設定。サイズを相対指定。
6plt.legend(fontsize="xx-large")
7# グラフタイトル設定
8plt.title(f"legend_fontsize_xx_large")
9plt.tight_layout()
10plt.show()
fontsizeを指定することで、凡例のハンドラーと文字のサイズを変更できる。
1# フォントサイズ:14pt
2plt.legend(fontsize=14)
3
4# フォントサイズ57.9%
5plt.legend(fontsize="xx-small")
6
7# フォントサイズ69.4%
8plt.legend(fontsize="x-small")
9
10# フォントサイズ83.3%
11plt.legend(fontsize="small")
12
13# フォントサイズ100%
14plt.legend(fontsize="medium")
15
16# フォントサイズ120%
17plt.legend(fontsize="large")
18
19# フォントサイズ144%
20plt.legend(fontsize="x-large")
21
22# フォントサイズ172.8%
23plt.legend(fontsize="xx-large")