iterm2起動時のウィンドウサイズを変更する【Mac】
MAX
MAX999blog


グラフの凡例(レジェンド)の位置はデフォルトでは、グラフの内容に応じてグラフ内の最適な位置に表示されるが、グラフ外に表示したり、全てのグラフで表示位置を統一したい時などがある。
グラフ内での表示位置調整は基本的にlocにrightやleftなどを指定するだけなので、割と直感的にできる。
グラフ外の表示位置調整は少しだけ慣れが必要だが、代表的なパターンを覚えておけば、十分。
seabornからサンプルデータとしてtitanicを読み込み、棒グラフを作成する。
1import numpy as np
2import pandas as pd
3
4import matplotlib.pyplot as plt
5import japanize_matplotlib
6import seaborn as sns
7
8%matplotlib inline
9
10# titanicデータの読み込み
11df_titanic = sns.load_dataset("titanic")1# グラフのサイズ、背景色設定
2plt.figure(figsize=(6, 4), facecolor="w")
3# 棒グラフ作成
4sns.barplot(data=df_titanic, x="pclass", y="survived", hue="sex")
5# レジェンドの位置設定
6plt.legend(loc="best")
7# グラフタイトル設定
8plt.title(f"legend_loc_best")
9plt.tight_layout()
10plt.show()

plt.legend(loc="best")と明示的にlocをbestにしたが、デフォルト値がbestなので、特に指定する必要はない。
デフォルトだとグラフ内のグラフと重ならない場所に凡例が表示される。
plt.legend()のlocに位置を設定することで変更する。
基本的にはplt.legend(loc="上下の位置 左右の位置")で指定する。
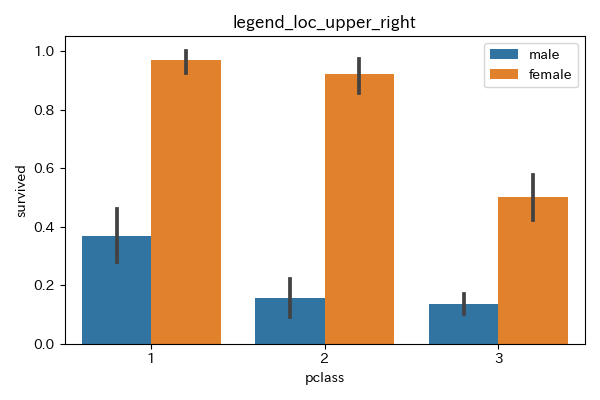
locに「upper right」または1を指定する。
1# グラフのサイズ、背景色設定
2plt.figure(figsize=(6, 4), facecolor="w")
3# 棒グラフ作成
4sns.barplot(data=df_titanic, x="pclass", y="survived", hue="sex")
5# レジェンドの位置設定。loc=1でも同じ。
6plt.legend(loc="upper right")
7# グラフタイトル設定
8plt.title(f"legend_loc_upper_right")
9plt.tight_layout()
10plt.show()
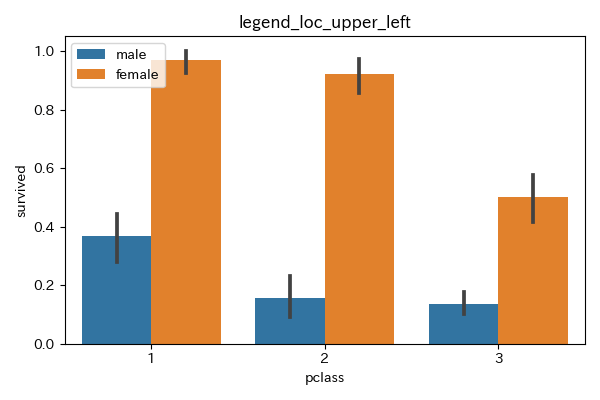
locに「upper left」または2を指定する。
1# グラフのサイズ、背景色設定
2plt.figure(figsize=(6, 4), facecolor="w")
3# 棒グラフ作成
4sns.barplot(data=df_titanic, x="pclass", y="survived", hue="sex")
5# レジェンドの位置設定。loc=2でもOK。
6plt.legend(loc="upper left")
7# グラフタイトル設定
8plt.title(f"legend_loc_upper_left")
9plt.tight_layout()
10plt.show()
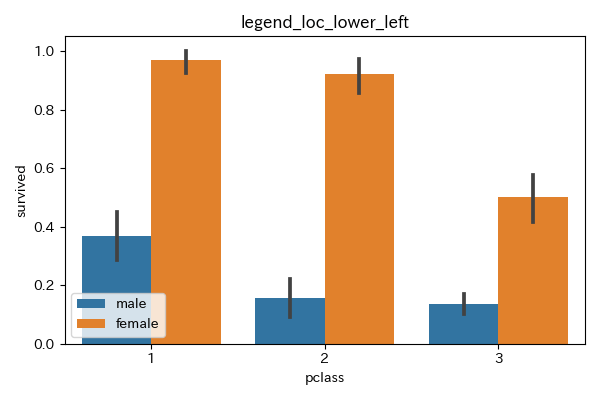
locに「lower left」または3を指定する。
1# グラフのサイズ、背景色設定
2plt.figure(figsize=(6, 4), facecolor="w")
3# 棒グラフ作成
4sns.barplot(data=df_titanic, x="pclass", y="survived", hue="sex")
5# レジェンドの位置設定。loc=3でもOK。
6plt.legend(loc="lower left")
7# グラフタイトル設定
8plt.title(f"legend_loc_lower_left")
9plt.tight_layout()
10plt.show()
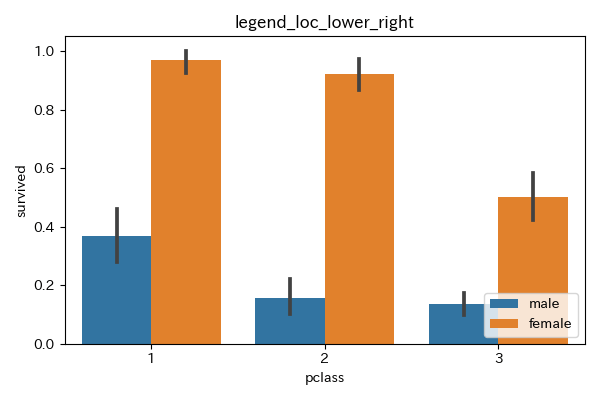
locに「lower right」または4を指定する。
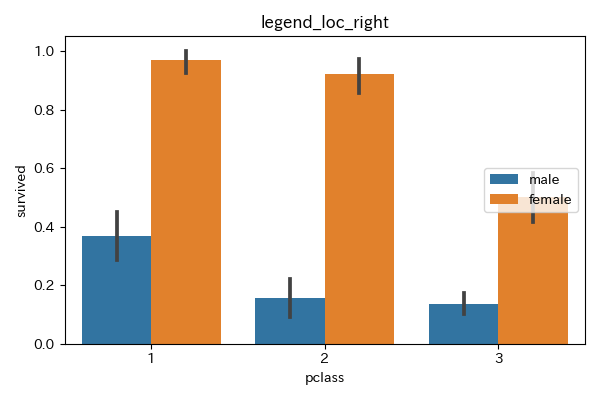
locに「right」または5、「center right」、「7」を指定する。
「right」に対応する数値が5、「center right」に対応する数値が7となる。
どちらも表示位置は同じ。
1# グラフのサイズ、背景色設定
2plt.figure(figsize=(6, 4), facecolor="w")
3# 棒グラフ作成
4sns.barplot(data=df_titanic, x="pclass", y="survived", hue="sex")
5# レジェンドの位置設定。loc=5でもOK。
6plt.legend(loc="right")
7# グラフタイトル設定
8plt.title(f"legend_loc_right")
9plt.tight_layout()
10plt.show()
1# グラフのサイズ、背景色設定
2plt.figure(figsize=(6, 4), facecolor="w")
3# 棒グラフ作成
4sns.barplot(data=df_titanic, x="pclass", y="survived", hue="sex")
5# レジェンドの位置設定。loc=7でもOK。
6plt.legend(loc="center right")
7# グラフタイトル設定
8plt.title(f"legend_loc_center_right")
9plt.tight_layout()
10plt.show()

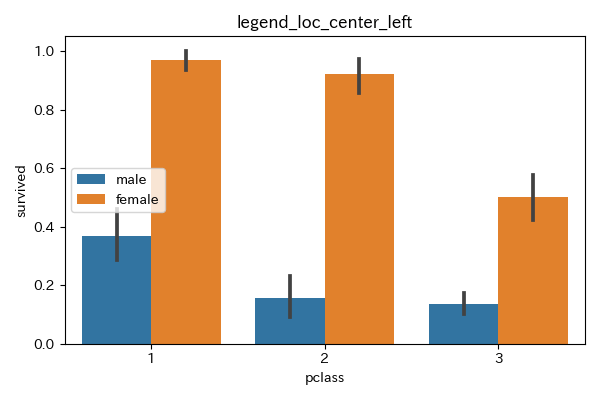
locに「center left」または6を指定する。
こちらは「left」だとエラーになることに注意。
1# グラフのサイズ、背景色設定
2plt.figure(figsize=(6, 4), facecolor="w")
3# 棒グラフ作成
4sns.barplot(data=df_titanic, x="pclass", y="survived", hue="sex")
5# レジェンドの位置設定。loc=6でもOK。
6plt.legend(loc="center left")
7# グラフタイトル設定
8plt.title(f"legend_loc_center_left")
9plt.tight_layout()
10plt.show()
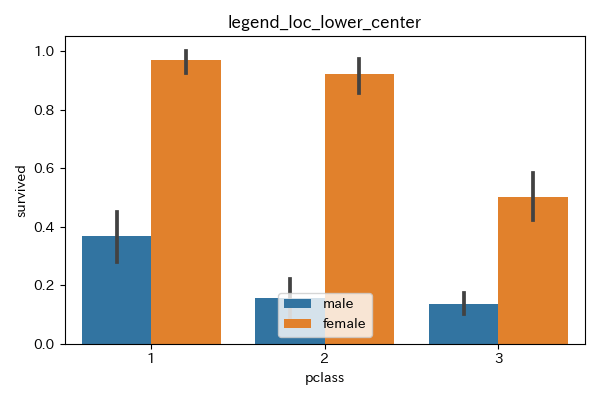
locに「lower center」または8を指定する。
1# グラフのサイズ、背景色設定
2plt.figure(figsize=(6, 4), facecolor="w")
3# 棒グラフ作成
4sns.barplot(data=df_titanic, x="pclass", y="survived", hue="sex")
5# レジェンドの位置設定。loc=8でもOK。
6plt.legend(loc="lower center")
7# グラフタイトル設定
8plt.title(f"legend_loc_lower_center")
9plt.tight_layout()
10plt.show()
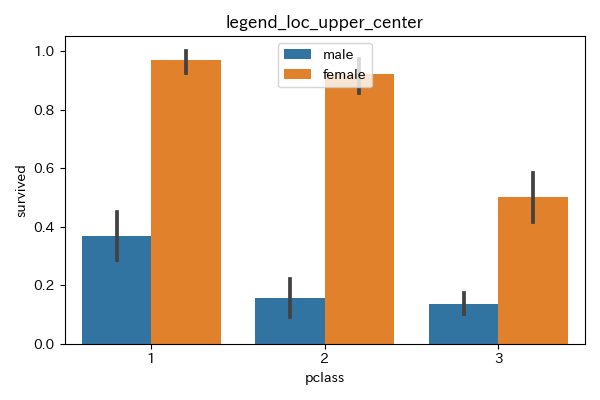
locに「upper center」または9を指定する。
1# グラフのサイズ、背景色設定
2plt.figure(figsize=(6, 4), facecolor="w")
3# 棒グラフ作成
4sns.barplot(data=df_titanic, x="pclass", y="survived", hue="sex")
5# レジェンドの位置設定。loc=9でもOK。
6plt.legend(loc="upper center")
7# グラフタイトル設定
8plt.title(f"legend_loc_upper_center")
9plt.tight_layout()
10plt.show()
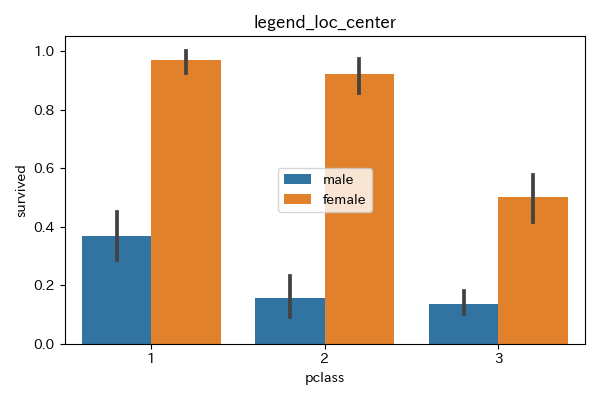
locに「center」または10を指定する。
グラフのど真ん中に凡例が表示される。
1# グラフのサイズ、背景色設定
2plt.figure(figsize=(6, 4), facecolor="w")
3# 棒グラフ作成
4sns.barplot(data=df_titanic, x="pclass", y="survived", hue="sex")
5# レジェンドの位置設定。loc=10でもOK。
6plt.legend(loc="center")
7# グラフタイトル設定
8plt.title(f"legend_loc_center")
9plt.tight_layout()
10plt.show()
グラフによっては、上下左右のどこにも凡例の表示位置がなかったり、凡例の数が多くてグラフ内に表示したくない場合もある。
そのような時はグラフの外に表示するのが見やすい。
locとbbox_to_anchorも設定することで、凡例の表示位置をより柔軟に指定することが可能となる。
代表的な使い方のパターンは以下の通り。
1# グラフのサイズ、背景色設定
2plt.figure(figsize=(6, 4), facecolor="w")
3# 棒グラフ作成
4sns.barplot(data=df_titanic, x="pclass", y="survived", hue="sex")
5# レジェンドの位置設定
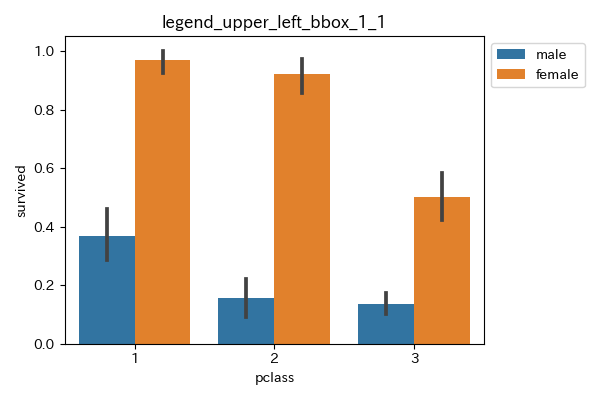
6# グラフの左下が(0, 0)、右上が(1, 1)
7# 凡例の左上の位置が(1, 1)になるように設定(loc="upper left")
8# 凡例の左上が図の右上の来るように配置(bbox_to_anchor=(1, 1))
9plt.legend(loc="upper left", bbox_to_anchor=(1, 1))
10# グラフタイトル設定
11plt.title(f"legend_upper_left_bbox_1_1")
12plt.tight_layout()
13plt.show()
1# グラフのサイズ、背景色設定
2plt.figure(figsize=(6, 4), facecolor="w")
3# 棒グラフ作成
4sns.barplot(data=df_titanic, x="pclass", y="survived", hue="sex")
5# レジェンドの位置設定
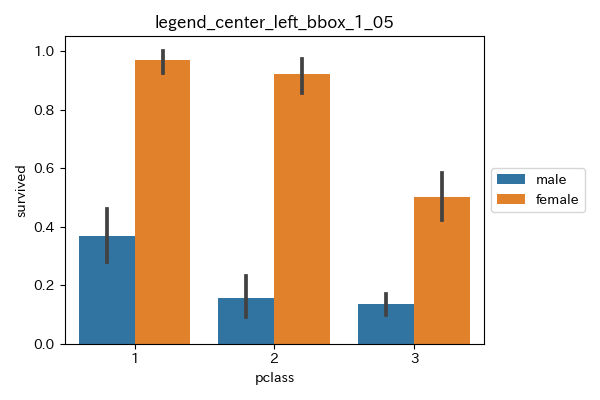
6# 図の左下が(0, 0)、右上が(1, 1)
7# 凡例の左中央の位置が(1, 0.5)になるように設定
8# 凡例の左中央が図の右側の真ん中に来るように配置される。
9plt.legend(loc="center left", bbox_to_anchor=(1, 0.5))
10# グラフタイトル設定
11plt.title(f"legend_center_left_bbox_1_05")
12plt.tight_layout()
13plt.show()
1# グラフのサイズ、背景色設定
2plt.figure(figsize=(6, 4), facecolor="w")
3# 棒グラフ作成
4sns.barplot(data=df_titanic, x="pclass", y="survived", hue="sex")
5# レジェンドの位置設定
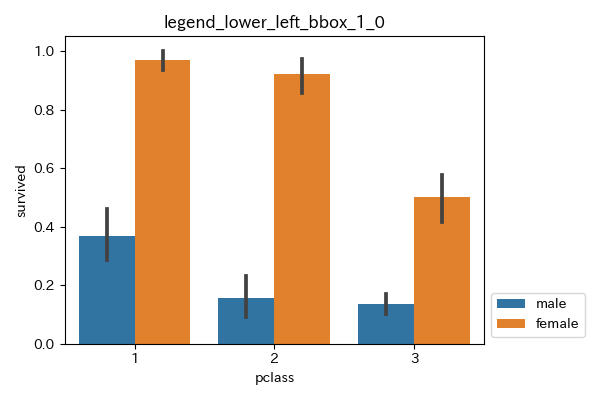
6# 図の左下が(0, 0)、右上が(1, 1)
7# 凡例の左下の位置が(1, 0)になるように設定
8# 凡例の左下が図の右下の来るように配置される。
9plt.legend(loc="lower left", bbox_to_anchor=(1, 0))
10# グラフタイトル設定
11plt.title(f"legend_lower_left_bbox_1_0")
12plt.tight_layout()
13plt.show()
グラフ内であれば、locを指定して凡例の位置を変更可能。
locと合わせて、bbox_to_anchorも指定することでグラフ内外でより柔軟に凡例の表示位置を変更可能。
1# レジェンドの位置設定
2# 最適な位置(自動で凡例配置)
3plt.legend(loc="best")
4# or
5plt.legend(loc=0)
6
7# 右上
8plt.legend(loc="upper right")
9# or
10plt.legend(loc=1)
11
12# 左上
13plt.legend(loc="upper left")
14# or
15plt.legend(loc=2)
16
17# 左下
18plt.legend(loc="lower left")
19# or
20plt.legend(loc=3)
21
22# 右下
23plt.legend(loc="lower right")
24# or
25plt.legend(loc=4)
26
27# 右中段
28plt.legend(loc="right")
29# or
30plt.legend(loc=5)
31# or
32plt.legend(loc="center right")
33# or
34plt.legend(loc=7)
35
36# 左中段
37plt.legend(loc="center left")
38# or
39plt.legend(loc=6)
40
41# 中央下
42plt.legend(loc="lower center")
43# or
44plt.legend(loc=8)
45
46# 中央上
47plt.legend(loc="upper center")
48# or
49plt.legend(loc=9)
50
51# 中央
52plt.legend(loc="center")
53# or
54plt.legend(loc=10)
55
56# グラフ外 右上
57plt.legend(loc="upper left", bbox_to_anchor=(1, 1))
58
59# グラフ外 右中段
60plt.legend(loc="center left", bbox_to_anchor=(1, 0.5))
61
62# グラフ外 右下
63plt.legend(loc="lower left", bbox_to_anchor=(1, 0))